
The Cost Overrun Problem
If you’ve worked on construction projects, you know cost overruns are common. But while most projects exceed budgets by small amounts (say 10–20%), a few megaprojects explode in cost — sometimes by 500%, 1,000%, or more!
Consider these famous examples:
- Sydney Opera House — Budgeted at $7M, final cost: $102M (1,400% overrun).
- Boston’s Big Dig — Estimated at $2.6B, final cost: $14.6B (460% overrun).
- Berlin Brandenburg Airport — Originally €2B, final cost: €7B+ (250% overrun).
The shocking part? These extreme overruns aren’t rare accidents — they follow a pattern.
The Hidden Risk: Fat-Tailed Distributions
Most people assume cost overruns follow a normal distribution (bell curve), where extreme overruns should be nearly impossible. But in reality, overruns follow a fat-tailed distribution, meaning:
✅ Small overruns are common (0–20%).
✅ Medium overruns happen occasionally (20–100%).
⚠️ Extreme overruns (200%+) are FAR more common than expected!
The Mean vs. Median Trap:
- In normal distributions, the mean and median are similar, so averages work well.
- In fat-tailed distributions, the mean is much higher than the median because a few massive outliers distort the data.
- Example: If 90% of projects stay within 20% overruns, but 10% explode by 500%+, the average overrun will be misleadingly high.
Nothing is better than some graphs:)
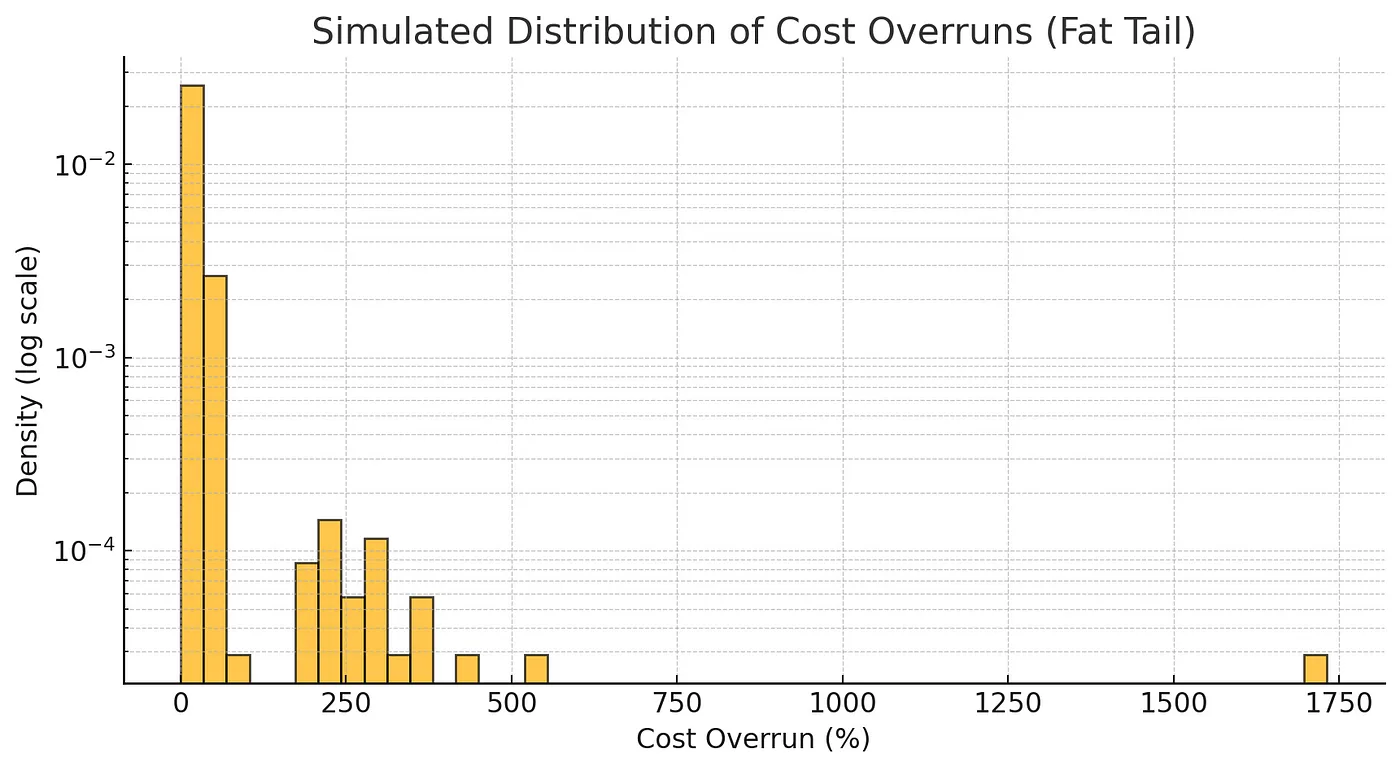
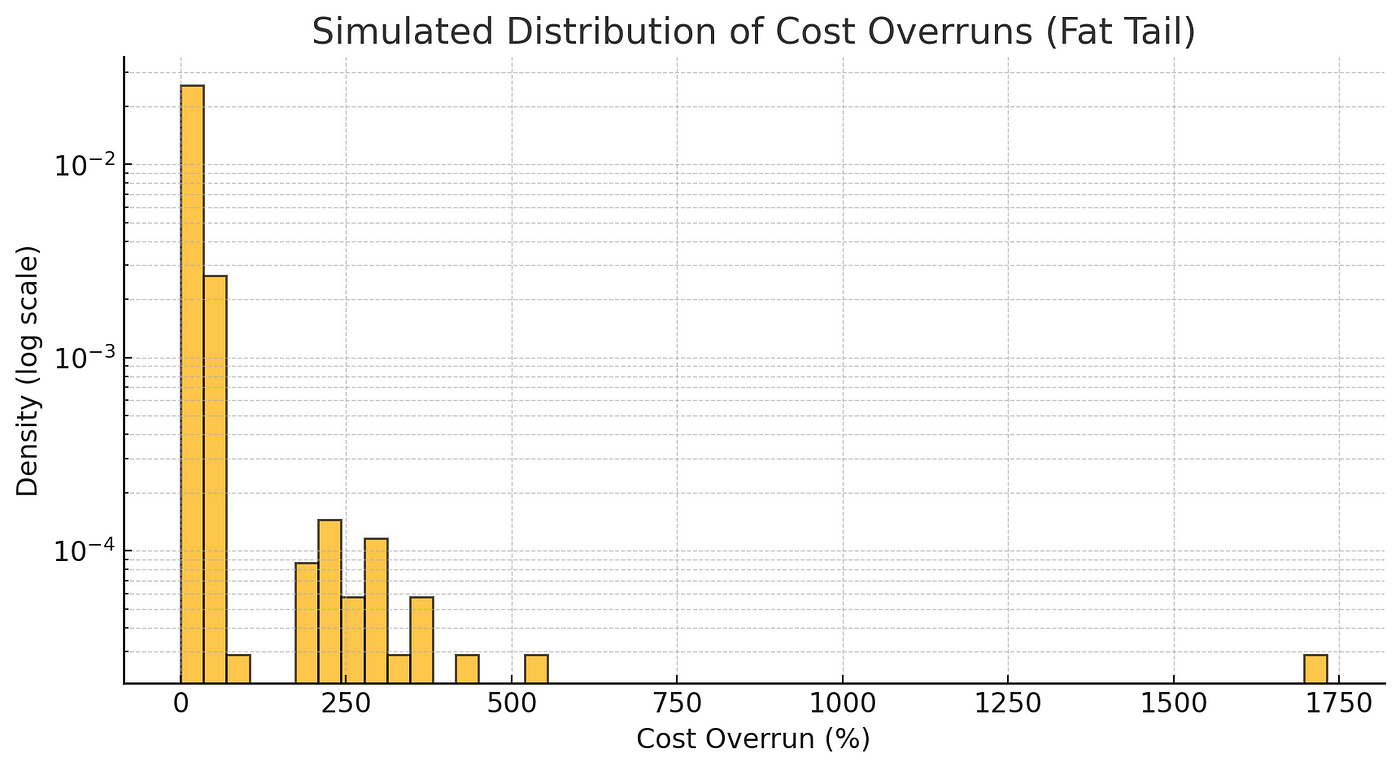
A fat Tail distribution, with simulated numbers of 1000 projects.
- A high concentration of small overruns (most projects around 10–30%).
- A gradual decline with some moderate overruns (50–200%).
- A long tail with extreme cases (a few projects at 500%+).
I guess that you all are familiar with normal distribution, but how are they both look combined?

Fat-Tailed Distribution: Mean: 27.46%. Median: 20.56%
- The mean is inflated by extreme overruns, making it much higher than the median.
Normal Distribution: Mean: 32.27%. Median: 31.83%.
- Here, the mean and median are close together, as expected in a normal distribution.
In the fat-tailed case, a few extreme projects pull the mean upward, making it misleading. In a normal distribution, the mean and median are nearly the same, meaning the average is a reliable estimate.
Using the mean to predict cost overruns in a fat-tailed world underestimates risk because rare but massive overruns are much more likely than expected.
Why Traditional Risk Models Fail
Most cost estimation models assume that project overruns follow a normal distribution, where extreme cases are rare and predictable. This assumption leads to three major failures in risk planning:
Underfunded Contingency Reserves
- Traditional budgeting adds a fixed contingency (e.g., 10–20%) based on historical averages.
- But in a fat-tailed world, a handful of projects exceed 100%, 300%, or even 1,000% overruns — making standard contingencies woefully inadequate.
- Example: If a bridge project has a 5% chance of a 300% overrun, a fixed 20% contingency won’t cover it, leading to mid-project funding crises.
False Confidence in Cost Estimates
- Planners rely on means and standard deviations to predict cost outcomes, but in fat-tailed distributions, the mean is highly unreliable because it’s skewed by extreme cases.
- Megaprojects often look well-planned on paper but become disasters when unexpected risks materialize.
- Example: The Berlin Brandenburg Airport was originally estimated at €2B, with “conservative” estimates. Final cost? Over €7B — a 250% overrun.
Budget Blowouts That Spiral Out of Control
- When extreme overruns occur, they often trigger chain reactions:
✅ Additional delays → Higher financing costs
✅ Contractor disputes → Legal battles → More overruns
✅ Political pressure → Rushed fixes → Poor-quality execution - These spirals are what make megaprojects fail spectacularly, not just go slightly over budget.
- Example: The Boston Big Dig saw costs balloon 460% due to compounding failures like tunnel leaks, faulty design, and contractor lawsuits.
The Bottom Line:
When risk models ignore fat tails, projects consistently underestimate worst-case scenarios, leading to blown budgets, financial crises, and damaged reputations.
How to Manage Fat-Tailed Risks in Construction
If we accept that cost overruns follow a fat-tailed distribution, we need smarter risk management:
Use Extreme Value Theory (EVT) — Instead of assuming overruns cluster around an average, model extreme cases explicitly.
Monte Carlo Simulations — Run thousands of scenarios to see how often extreme overruns occur.
Allocate Contingency Based on Tail Risk — Instead of a fixed 10–20%, plan for 90th percentile worst-case scenarios.
Identify High-Risk Factors Early — Geological issues, regulatory delays, and funding gaps often drive massive overruns. Address them upfront.
Use Flexible Contracts & Modular Construction — Reducing rigidity allows for mid-project adjustments instead of catastrophic budget failures.
The Takeaway
Megaprojects don’t just “occasionally” go over budget — they follow a fat-tailed risk pattern. If we fail to recognize this, we’ll keep underestimating extreme cost overruns. But if we embrace a fat-tailed mindset, we can plan for the unexpected and build projects that actually stay within budget!
